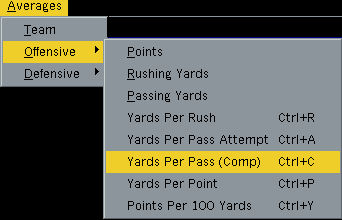
Here you can view a massive number of statistics for the upcoming games. When you first enter the screen you will see (from left to right each for the offense and defense)
Points, Rushing Yards (ave.), Passing Yards (ave.), Yards per Rush, Yards per Pass, Rushing attempts (ave.), Passing attempts (ave.), Pass Completions (ave.), Interceptions, Fumbles, Passing Percentage, Yards per pass attempt (ave.), Sacks, and Points per 100 yards Gained.
All of these are averaged on the number of games you use in your formula (as indicated in the title). If you click on a column the program displays all teams rank in that offensive stat.

On the menu bar, you can get (under View) Simplified stats either in number form of as letters (A, B, C, D and F). If you choose numbers MrCFB will take the home teams offensive stats and average them with the away teams defensive stats and give you a predicted amount next to the home team, it will then do the same for the defense.
For Example:
Team A averages 100 yards rushing a game and they are playing team B who's defense averages 50 yards per game given up MrCFB will average these and predict Team A will gain 75 yards. These numbers are not affected by the rush / pass, offense / defense numbers in your formula, they are straight averages. The Letters will take these numbers and compare them to historical statistical averages and "grade" each team in each category. This is an easy way to find mismaches - a quick scan and you can see an "A" vs an "F" without having to compare the numbers.

Also, on the menu are numerous statistical categories you can choose to view, all will be ranked from best to worst and show the league average.
Copyright © 2007 Richard Tolliver / Tolliver Software. All rights reserved.